New TLDs (nTLDs) continue to progress (+19% stock in 2019) and could indeed shift the balance in coming years.
Innovation, particularly in terms of cybersecurity services based on domain names, creates value and now plays a decisive role in the market.
Afnic, the association that manages and operates various TLDs including the .fr, has published its annual report on the global domain name market.
The report highlights a slight upturn in the market, which has generally continued the growth initiated in 2018. The global domain name market thus accounted for approximately 346 million domain names at the end of December 2019, up 4.7% compared to the 4.0% in 2018.
Distribution among the main TLDs:
- 181 million legacy TLDs (.com, .net, .org, etc.);
- 132 million ccTLDs (so-called “geographic” TLDs, corresponding to a territory or country like the .fr);
- 33 million “new TLDs” created from 2014 onwards (nTLDs encompass different segments including the geoTLD – .bzh, .paris, .alsace, etc. – TLDs corresponding to brands – .sncf, .mma – community TLDs and generic TLDs).

m DNs: Year-end data expressed in millions of Domain Names.
* Other Legacy TLDs: generic TLDs created before 2012, such as .aero, .asia, .biz, .net, .org, .info, .mobi, etc.
** Total gTLDs: measures all the domain names managed under a contract with ICANN.
*** ccTLDs or “country code Top-Level Domains”, domains corresponding to territories, such as the . fr for France. The data presented no longer includes “Penny TLDs” i.e. ccTLDs retailed at very low prices, if not free of charge. These ccTLDs are subject to very large upward and downward movements that do not reflect actual market developments and bias aggregate data.
**** Penny ccTLDs: estimated volume of names filed in these “low-cost” or free domains.
Global market trends in 2019 – key figures
- With 149 million names, the .COM remains the uncontested leader, but its market share remains unchanged at 43.1%.
- Country-code TLDs (ccTLDs) ended the year with growth of +4.7%, recording improved performance on 2018 (+3.4%).
- The Other Legacy TLDs continued to suffer in 2019, losing 6% in stock (-2 million) on the back of the 6% loss of 2018.
- nTLDs recorded a 19% gain in stock (+6 million), following the +15% gain of 2018. Their market share rose to 9% compared to 8% in 2018.
The market shares of the different segments are fairly static overall, the main change being the decline in “Other Legacy TLDs” in favour of nTLDs.
nTLD: a growth vector?
The same data expressed in net balance highlight the weight of the different segments in the overall performance of the market in 2019. Accordingly, the role of the .COM as “market maker” seems to be waning; in 2019 it accounted for just 43% of the net balance (compared with 56% in 2018 and 156% in 2017), while ccTLDs contributed 37% and nTLDs 33%.

This table shows the contributions of the different TLDs to the net balance. The value is negative when there is a drop in stock.
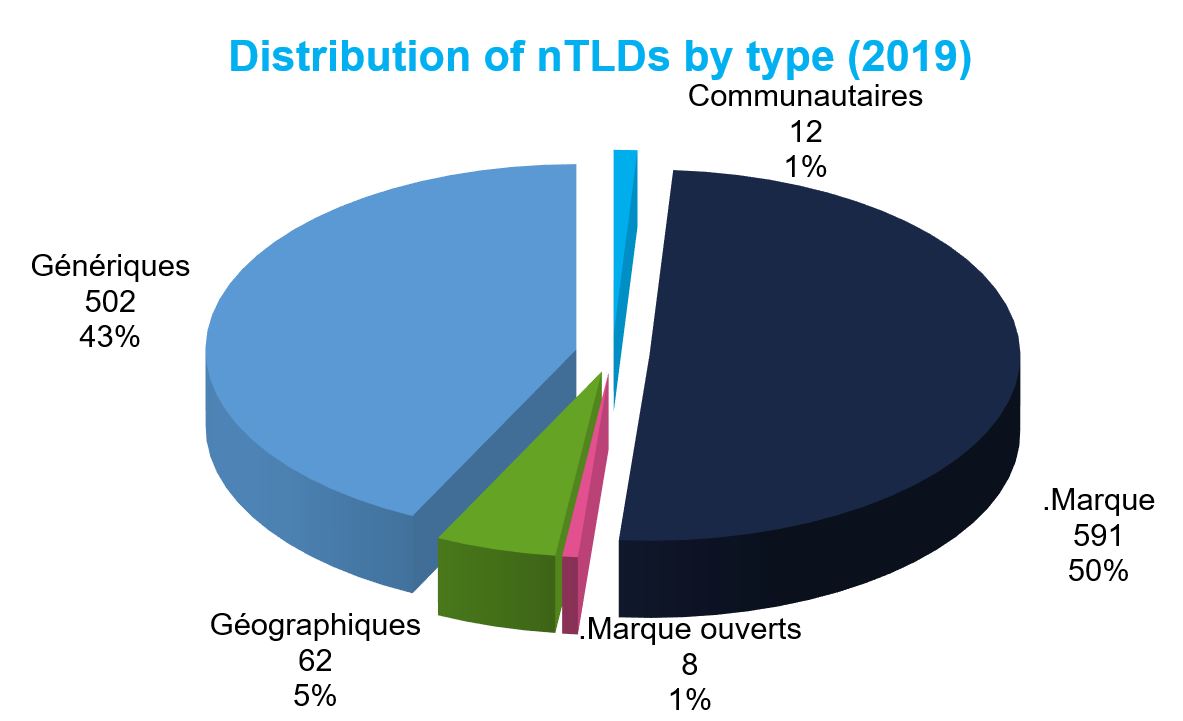
What exactly are these “new TLDs”? Afnic has provided a typology in order to better understand their dynamics. Generic, geographic, open .brand, “closed” .brand and community TLDs are the main categories.
Performance of new TLD “segments”

The “closed” .brands correspond to the traditional acceptance of the notion of .brands (use on holder’s own behalf). Then the “open” .brands, the dynamics of which are very different: the holder uses its .brand by opening it up to third parties in accordance with procedures at its discretion. Afnic identified eight open .brands in 2019: .app, .dev, .fun, .icu, .one, .ovh, .page, .realestate.
Among the nTLD segments, Community TLDs suffered from the continued collapse of the .ру�? (Russian), losing 20% in 2019. Geographic TLDs also posted a slight loss (-5%), while Generic TLDs were stable overall (-1%).
.brands in the lead!
This classification underlines the exceptional performance of the open .brand segment (primarily due to the .icu which gained 4.6 million names) with growth of 5.6 million names in absolute terms and 549% as a percentage. Another noteworthy observation, the retention rate improved considerably, testimony to a tendency to loyalty on the part of these domain name holders.
The classic .brands meanwhile grew by 8% in 2019, create operations falling by 34% but offset by a very high retention rate (88%) which improved slightly (+1 pp).

This chart demonstrates the growing importance .brands have gained since the opening of the first ICANN round, representing over 50% of TLDs created at that time. Many pioneering businesses seized this opportunity, like the .sncf in France, and the second round set for 2022/23 could well see this segment skyrocket. With a renewal rate close to 90%, the segment has also confirmed its long-term success.
“These TLDs exude confidence, they institutionalise brands and create value. Businesses that took the leap in 2012 can really see the effects when developing their digital strategy based on their .brand. Those of 2012 were pioneers. Nowadays the Internet, brand websites, recruitment and e-commerce have grown to such an extent that TLDs also form a significant part of their brand territory, and are becoming essential to big groups”, explains Loïc Damilaville, Survey and Market Intelligence Manager, Afnic.
New services that are revitalising the market
In this study, Afnic also analyses the market’s growth levers and presents some of the many innovations of 2019. Indeed, the players in the ecosystem have stepped up their efforts to propose new value-added services.
Cybersecurity and security surrounding the DNS in particular were the focus of attention. The massive attacks of late 2018 contributed significantly to this awareness, and gave rise to communications on and promotion of DNSSEC solutions and “locking” services. The emergence of numerous offers positioned at the confluence of issues surrounding Data, Security and (Brand) Monitoring should also be noted.
The search for innovations in themes connected with domain names (Data, Cybersecurity, IoT, digital identities, etc.) has intensified. This trend is set to continue as domain names increase in number along with their use.
Post COVID-19 outlook
“The coronavirus crisis makes the situation difficult to read with regard to the developments in the domain name market in the short and medium term as it introduces a large number of factors of uncertainty. It seems to have spurred the create operations of many TLDs over the first half of the year. It remains to be seen whether this acceleration of the digital transition of many businesses was a one-off reaction or the start of a durable shift in practices among VSEs/SMEs”, concludes Pierre Bonis, CEO of Afnic.
- Download the full study “The Global Domain Name Market in 2019“
About Afnic
Afnic is the acronym for Association Française pour le Nommage Internet en Coopération, the French Network Information Centre. The registry has been appointed by the French government to manage domain names under the .fr Top Level Domain. Afnic also manages the .re (Reunion Island), .pm (Saint-Pierre and Miquelon), .tf (French Southern and Antarctic Territories), .wf (Wallis and Futuna) and .yt (Mayotte) French Overseas TLDs.
In addition to managing French TLDs, Afnic’s role is part of a wider public interest mission, which is to contribute on a daily basis, thanks to the efforts of its teams and its members, to a secure and stable internet, open to innovation and in which the French internet community plays a leading role. As part of that mission, Afnic, a non-profit organization, has committed to devoting 11% of its Revenues from managing .fr Top Level Domain to actions of general interest, in particular by transferring €1.3 million each year to the Afnic Foundation for Digital Solidarity.
Afnic is also the back-end registry for the companies as well as local and regional authorities that have chosen to have their own TLD, such as .paris, .bzh, .alsace, .corsica, .mma, .ovh, .leclerc and .sncf.
Established in 1997 and based in Saint-Quentin-en-Yvelines, Afnic currently has nearly 90 employees.


