On 28 July 2022, Verisign, the registry for the .COM and .NET TLDs, announced that it would be applying a 10% increase in the price of .NET domains as of 1 February 20231. This followed the announcement a few months back of a second price increase for the .COM TLD as of 1 September 20222, the first since 2012 having been applied on 1 September 20213.
The aim of this study is to evaluate the impact of the price changes on the performance of the two TLDs, and to question the Verisign strategy in light of the data collected.
Contractually authorised increases
These repeated increases are applied as part of the contracts binding Verisign to ICANN, which are periodically renegotiated. The current contract in force for .COM dates back to 2012, and was revised and extended in 20184. Dated 27 March 2020, an amendment sets out in alinea 17 the authorisation granted by ICANN to Verisign to increase its prices by 7% per year in each year of the final four years of the six years covered by the contract. Given that the contract was renewed in 2018, the increases began in 2021 and could be applied each year in 2022 (confirmed), 2023 and 20245, potentially raising the price of the .COM TLD to US$ 10.27 at the end of 2024.
The principle is identical for the .NET TLD under the contract in place since 20176. Its section 7.3 states that Verisign cannot increase its prices by more than 10% per year. However, it is free to apply these increases every year for .NET. Verisign has been relatively moderate on this front: prices for .NET did indeed increase by 10% a year between 2012 and 2018, but then remained stable from 2019 – 2022 and will only increase again in 2023. Because although Verisign has a contractual right to increase its prices, it does not have to do so.
The graph below shows the changes to the .COM and .NET prices between 2011 and 2024, on the ‘pessimistic’ assumption that .COM will increase by 7% in 2023 and 2024, and .NET by 10% in 2024 as in 2023.
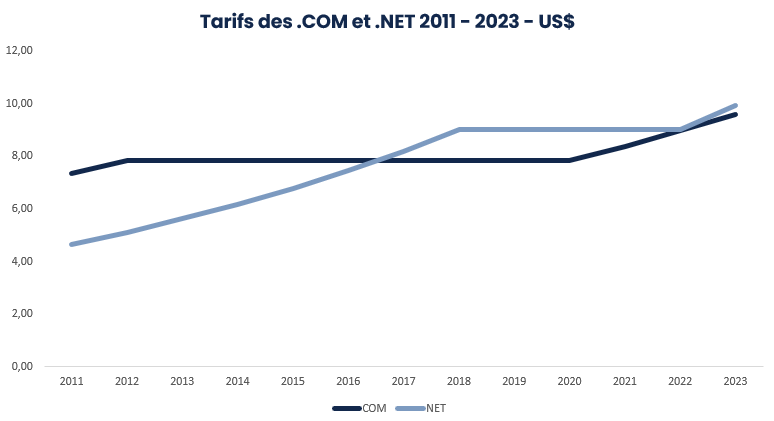
| Price on 31/12 | 2011 | 2012 | 2013 | 2014 | 2015 | 2016 | 2017 | 2018 | 2019 | 2020 | 2021 | 2022 | 2023 |
| COM | 7,34 | 7,85 | 7,85 | 7,85 | 7,85 | 7,85 | 7,85 | 7,85 | 7,85 | 7,85 | 8,39 | 8,97 | 9,60 |
| NET | 4,65 | 5,11 | 5,62 | 6,18 | 6,79 | 7,46 | 8,20 | 9,02 | 9,02 | 9,02 | 9,02 | 9,02 | 9,92 |
Frozen for a long time by the pressure placed on ICANN by the US Congress in 2012, the price of the .COM TLD only began to increase in 20217. As for the .NET TLD, it will have increased from $4.65 to $10 between 2011 and 2024 with a ‘plateau’ between 2018 and 2022. By 2024, the two domains could therefore both cost more than $10 at registry level.
Nominal prices and actual prices
Do these prices correspond to the prices actually paid by all registrars? Probably not. Verisign has the right to run promotional campaigns that play on prices (discounts, etc.). We can establish a calculation, albeit imperfect, of the phenomenon by comparing published revenues8 with the revenues theoretically generated by .COM and .NET.
| 2011 | 2012 | 2013 | 2014 | 2015 | 2016 | 2017 | 2018 | 2019 | 2020 | 2021 | |
| Number of .COM | 101,6 | 108,5 | 114,4 | 119,0 | 126,6 | 131,3 | 135,0 | 142,0 | 148,8 | 155,3 | 163,5 |
| Number of .NET | 14,7 | 15,3 | 15,5 | 15,5 | 16,2 | 16,1 | 15,0 | 14,3 | 13,7 | 13,7 | 13,7 |
| Number .COM & N.ET | 116 | 124 | 130 | 135 | 143 | 147 | 150 | 156 | 163 | 169 | 177 |
| Revenue/domain | 6,6 | 7,1 | 7,4 | 7,5 | 7,4 | 7,7 | 7,8 | 7,8 | 7,6 | 7,5 | 7,5 |
| Average .COM price | 7,34 | 7,83 | 7,85 | 7,85 | 7,85 | 7,85 | 7,85 | 7,85 | 7,85 | 7,85 | 8,03 |
| Average .NET price | 4,65 | 5,09 | 5,37 | 6,13 | 6,74 | 7,40 | 8,14 | 8,95 | 9,02 | 9,02 | 9,02 |
| Theorical average .COM revenue | 746 | 849 | 898 | 934 | 994 | 1 031 | 1 060 | 1 115 | 1 168 | 1 219 | 1 313 |
| Theorical average .NET revenue | 68 | 78 | 83 | 95 | 109 | 119 | 122 | 128 | 124 | 124 | 124 |
| Total theorical revenue | 814 | 927 | 981 | 1 029 | 1 103 | 1 150 | 1 182 | 1 243 | 1 292 | 1 343 | 1 437 |
| Delta / published revenue | -42 | -54 | -16 | -19 | -44 | -8 | -17 | -28 | -60 | -78 | -109 |
| % delta | -5% | -6% | -2% | -2% | -4% | -1% | -1% | -2% | -5% | -6% | -8% |
To calculate this notional revenue, I have taken the average annual price of each of the TLDs recalculated prorata temporis (given that the changes are never applied on 1 January) and multiplied by the stock of each domain at the end of the year. The principle is that this stock is formed of names created, transferred or renewed over the year, each name having generated invoicing at an average price over the past year.
The finding is that the published revenue has always been below the notional revenue, the delta ranging from 1% in 2016 and 2017 to 8% in 2021 with an average of 4% between 2011-2021.
This figure is a minimum given that Verisign has other sources of revenue than .COM and .NET alone. The company is also the back-end operator for numerous nTLDs and several ccTLDs (including .TV until 2021-2022). It can also exert its talents in less well-known sectors like cybersecurity. In short, the percentage variance between the published revenue and the notional revenue generated by .COM and .NET is a minimal estimate of the ‘gifts’ accorded by Verisign to registrars choosing to participate in its promotional operations. We can see that this delta indicates a step-up in ‘promotions’ between 2018-2021, the 8% in 2021 coinciding with the first price increase, as if Verisign had ‘announced’ the increase while not applying it on the whole to .COM registrars.
Performances of the TLDs
To conduct this study, I will be using two performance indicators taken from the reports sent by Verisign to ICANN and published in its Registry transactions Reports9: stocks at 31/12 of each year and monthly creations consolidated annually.
Based on these two official indicators, I can calculate the others: the volume of names retained and deleted over the year, the stock change, create and delete operations, the creation rate10 and retention rate11. This wide-ranging data will give us an idea of how the two TLDs have behaved and allow us to assess the impact of the pricing policy.
I’ve also calculated an estimated trajectory for 2022 based on the data published between January and May (latest data available in September 2022), ‘correcting’ them to take into account the average weight in terms of creations and deletions between 2011 and 2021. These trajectories are, of course, all the more reliable the closer we get to the end of the year. The ones given here are therefore subject to potentially significant variations.
Assumptions based on the impact of price increases
Before considering the data collected, it is worth pointing out what we should expect to see to confirm the existence of a negative impact of price increases on .COM and .NET activity.
I could consider that price increases have had a negative impact if we see:
- on the one hand, create operations fall significantly below ‘normal level’ (that is to say under 35 to 38 million names per year) with the result that the Creation Rate moves towards 20% over the medium term;
- on the other hand, retained names decline, leading to a marked deterioration in the Retention Rate moving towards 75% over the medium term
- the consequence of these two changes combined would be a loss of stock in varying degrees.
Faced with relatively brutal and repeated price increases, the holders of unused names will be forced to make trade-offs sooner or later to avoid overshooting their .COM budget. The two main categories of holders concerned are domainers, with portfolios of varying sizes destined for resale or ‘monetisation’, and rights holders who have registered a large number of names as a defensive measure to protect their brands. VSEs/SMEs and natural persons using their .COM domains will tend to keep them, on the other hand, as price hikes are not a critical factor for them given that they only generally hold a limited number of domain names.
KPIs for .COM
This brings me to the table below:
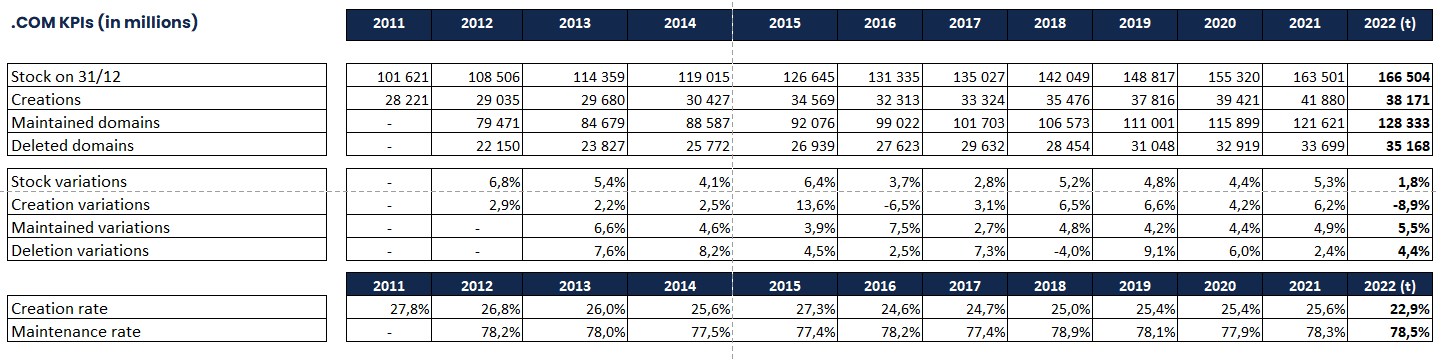
| .COM KPIs (in millions) | 2011 | 2012 | 2013 | 2014 | 2015 | 2016 | 2017 | 2018 | 2019 | 2020 | 2021 | 2022 (t) |
| Stock on 31/12 | 101 621 | 108 506 | 114 359 | 119 015 | 126 645 | 131 335 | 135 027 | 142 049 | 148 817 | 155 320 | 163 501 | 166 504 |
| Creations | 28 221 | 29 035 | 29 680 | 30 427 | 34 569 | 32 313 | 33 324 | 35 476 | 37 816 | 39 421 | 41 880 | 38 171 |
| Maintained domains | – | 79 471 | 84 679 | 88 587 | 92 076 | 99 022 | 101 703 | 106 573 | 111 001 | 115 899 | 121 621 | 128 333 |
| Deleted domains | – | 22 150 | 23 827 | 25 772 | 26 939 | 27 623 | 29 632 | 28 454 | 31 048 | 32 919 | 33 699 | 35 168 |
| Stock variations | – | 6,8% | 5,4% | 4,1% | 6,4% | 3,7% | 2,8% | 5,2% | 4,8% | 4,4% | 5,3% | 1,8% |
| Creation variations | – | 2,9% | 2,2% | 2,5% | 13,6% | -6,5% | 3,1% | 6,5% | 6,6% | 4,2% | 6,2% | -8,9% |
| Maintained variations | – | – | 6,6% | 4,6% | 3,9% | 7,5% | 2,7% | 4,8% | 4,2% | 4,4% | 4,9% | 5,5% |
| Deletion variations | – | – | 7,6% | 8,2% | 4,5% | 2,5% | 7,3% | -4,0% | 9,1% | 6,0% | 2,4% | 4,4% |
| 2011 | 2012 | 2013 | 2014 | 2015 | 2016 | 2017 | 2018 | 2019 | 2020 | 2021 | 2022 (t) | |
| Creation rate | 27,8% | 26,8% | 26,0% | 25,6% | 27,3% | 24,6% | 24,7% | 25,0% | 25,4% | 25,4% | 25,6% | 22,9% |
| Maintenance rate | – | 78,2% | 78,0% | 77,5% | 77,4% | 78,2% | 77,4% | 78,9% | 78,1% | 77,9% | 78,3% | 78,5% |
The data presented traces the history of the .COM TLD over the last ten years, according to the official data supplied by Verisign to ICANN. What I’m particularly interested in is the behaviour of the TLD in the wake of the price increase on 1 September 2021. To the best of my calculations, the 2022 trend is characterised by:
- A significant slowdown in growth which could drop from 5.3% in 2021 to around 2% in 2022
- A sharp drop in create operations (-9%), which should however be put in perspective given that 2021 represented an exceptional high linked to the COVID situation. If 2022 creations come in at around 38 million, they will be comparable to the 2019 level, meaning that the ‘spectacular’ fall is therefore, in reality, merely a return to ‘normal’ activity levels.
- Increased delete operations and the stock of retained names, the latter outpacing deletions, with an increased Retention Rate as a bonus.
Let us examine the Creation Rate and Retention Rate of the .COM TLD over the long term:
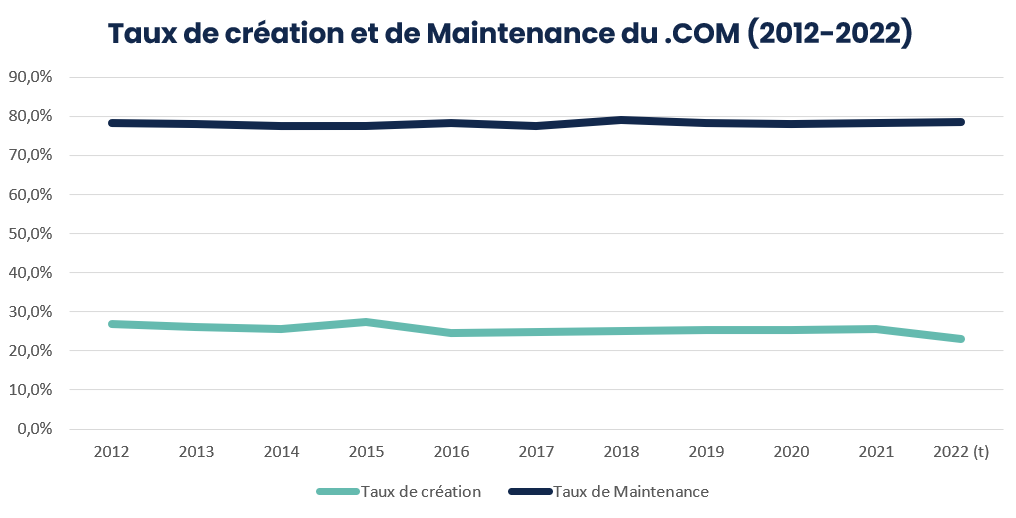
The Retention Rate has remained stable between 2012 and 2021, at slightly below 80%. The Creation Rate has also been stable overall since 2016. Only 2022 presents a significant deterioration, which is explained by a lower estimation for create operations than 2021 correlated to stock which continues to grow. The period 2020/2021 did not reveal any significant variations in these two indicators.
In short, the impact of the price increase on 1 September 2021 is, for now at least, relatively low profile: the fall in creations could be explained by a post-pandemic ‘return to normal’ and there has been no decline in renewals.
The latter could indicate that .COM is relatively resilient in comparison to price elasticity; and/or that the 2021 price hike is still too recent to be visible in renewal operations; and/or that it was not on a sufficient scale to force a significant proportion of holders to make trade-offs. The situation is naturally all the more changeable in that prices increased once again on 1 September 2022.
A ‘weak’ yet tell-tale sign and no doubt a worrying one for Verisign as it reflects a potential acceleration in the ‘downturn’: the net balance for the .COM TLD, which was 682,000 names per month on average in 2021, dropped to 423,000 on average between January and April 2022 and… to 4,000 in May.
KPIs for .NET
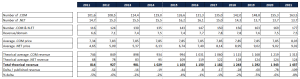
Now let’s look at the same indicators for the .NET TLD. As we can see, it has a very different physiognomy.
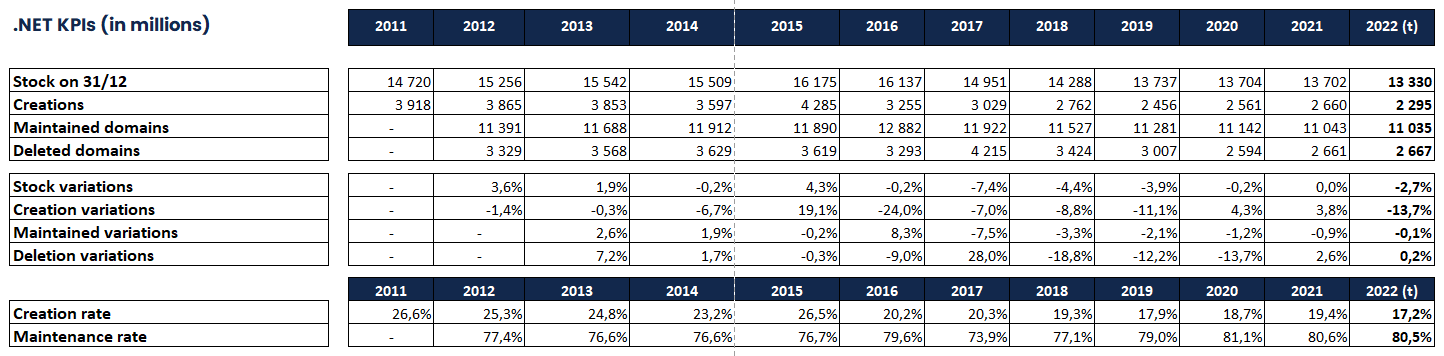
| .NET KPIs (in millions) | 2011 | 2012 | 2013 | 2014 | 2015 | 2016 | 2017 | 2018 | 2019 | 2020 | 2021 | 2022 (t) |
| Stock on 31/12 | 14 720 | 15 256 | 15 542 | 15 509 | 16 175 | 16 137 | 14 951 | 14 288 | 13 737 | 13 704 | 13 702 | 13 330 |
| Creations | 3 918 | 3 865 | 3 853 | 3 597 | 4 285 | 3 255 | 3 029 | 2 762 | 2 456 | 2 561 | 2 660 | 2 295 |
| Maintained domains | – | 11 391 | 11 688 | 11 912 | 11 890 | 12 882 | 11 922 | 11 527 | 11 281 | 11 142 | 11 043 | 11 035 |
| Deleted domains | – | 3 329 | 3 568 | 3 629 | 3 619 | 3 293 | 4 215 | 3 424 | 3 007 | 2 594 | 2 661 | 2 667 |
| Stock variations | – | 3,6% | 1,9% | -0,2% | 4,3% | -0,2% | -7,4% | -4,4% | -3,9% | -0,2% | 0,0% | -2,7% |
| Creation variations | – | -1,4% | -0,3% | -6,7% | 19,1% | -24,0% | -7,0% | -8,8% | -11,1% | 4,3% | 3,8% | -13,7% |
| Maintained variations | – | – | 2,6% | 1,9% | -0,2% | 8,3% | -7,5% | -3,3% | -2,1% | -1,2% | -0,9% | -0,1% |
| Deletion variations | – | – | 7,2% | 1,7% | -0,3% | -9,0% | 28,0% | -18,8% | -12,2% | -13,7% | 2,6% | 0,2% |
| 2011 | 2012 | 2013 | 2014 | 2015 | 2016 | 2017 | 2018 | 2019 | 2020 | 2021 | 2022 (t) | |
| Creation rate | 26,6% | 25,3% | 24,8% | 23,2% | 26,5% | 20,2% | 20,3% | 19,3% | 17,9% | 18,7% | 19,4% | 17,2% |
| Maintenance rate | – | 77,4% | 76,6% | 76,6% | 76,7% | 79,6% | 73,9% | 77,1% | 79,0% | 81,1% | 80,6% | 80,5% |
The stock of .NET peaked in 2015 and has steadily declined since, down from 16.2 million to 13.7 million at the end of 2021. Create operations have followed the same dynamic, down from 4.3 million in 2015 (an exceptional level) to 2.7 million in 2021. The database of retained names shrinks every year, while delete operations seem to be stabilising at around 2.5 million following a surge in 2017.
The 2022 trend is characterised by:
- A slight decline in stock (-3%);
- A substantial fall in create operations (-14%) compared to 2021, at a level (2.3 million) well below that prior to 2020;
- A database of retained names in equilibrium and delete operations up slightly (+0.2%)
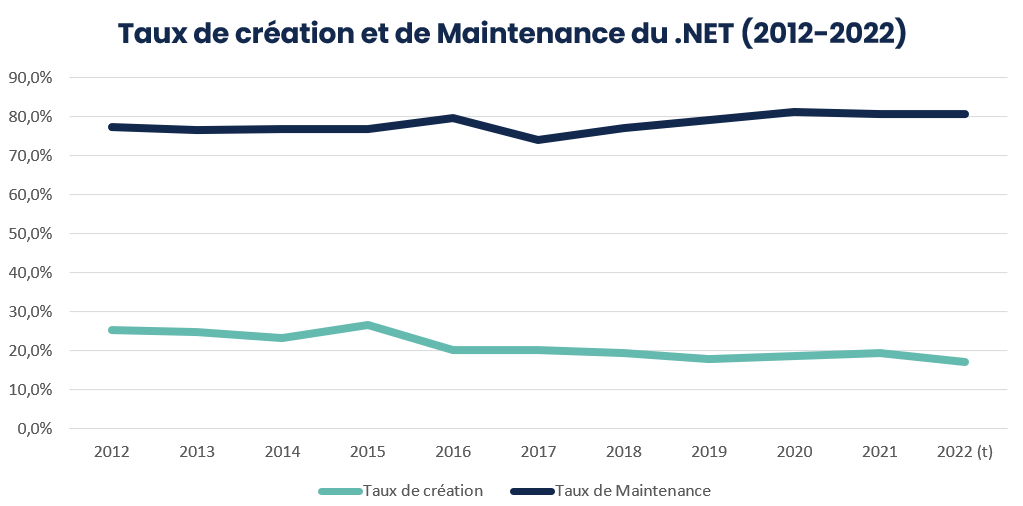
Let us examine the Creation Rate and Retention Rate of the .NET TLD over the long term:
| 2011 | 2012 | 2013 | 2014 | 2015 | 2016 | 2017 | 2018 | 2019 | 2020 | 2021 | 2022 (t) | |
| Creation rate |
26,6% | 25,3% | 24,8% | 23,2% | 26,5% | 20,2% | 20,3% | 19,3% | 17,9% | 18,7% | 19,4% | 17,2% |
| Maintenance rate |
– | 77,4% | 76,6% | 76,6% | 76,7% | 79,6% | 73,9% | 77,1% | 79,0% | 81,1% | 80,6% | 80,5% |
The .NET rates are less stable than those of .COM. The Retention Rate is slightly up on 2019 at 80% following a stall in 2017 and a ‘recovery’ in 2018. The Creation Rate dipped in 2016 and has stabilised at around 20%, but it seems to be declining significantly in 2022 (-2 points).
What happens if I compare these evolutions to the price changes (see table “.COM and .NET prices 2011-2024”)?
.NET prices increased constantly by 10% a year until 2018 before stabilising. Yet the key indicators for the TLD between 2016-2018 showed that it was beginning to struggle: warning bells for the 2017 Maintenance Rate and a drop below the 20% threshold for the Creation Rate. As we can see, there is a certain time lag between the application of the price rises and the moment where the impact becomes visible. This can be attributed to different causes:
- Existence of promotional operations making the price increases less ‘painful’ for registrars;
- Reluctance of registrars to pass on the full cost of the price rise to their customers (registrars prefer to compromise on their margins in this case rather than to risk losing customers);
- Inertia on the part of holders who have not kept an eye on price changes and who pay the new rate the first time round; only subsequently do their start thinking in terms of streamlining their portfolio.
These factors may explain the lack of impact observed for the .COM domain, which will only start to be visible in late 2022 – early 2023 if the timing is the same as for the .NET TLD.
In any case, it is as if Verisign, aware that it had entered a dangerous zone for .NET in 2017/2018, had chosen not to alter its prices in 2019-2022.
The usage rate: a vulnerability factor
A key parameter when it comes to evaluating the vulnerability of a TLD compared with price increases is, as we have seen, the use made of names by the holders. ‘Real’ users will tend to keep their names even if prices increase substantially, while ‘domainers’ and rights holders will more quickly be inclined to clean out their portfolios in order to stay within tolerable budget limits.
A tool developed by CENTR gives an overview of the main usage categories for .COM and .NET.
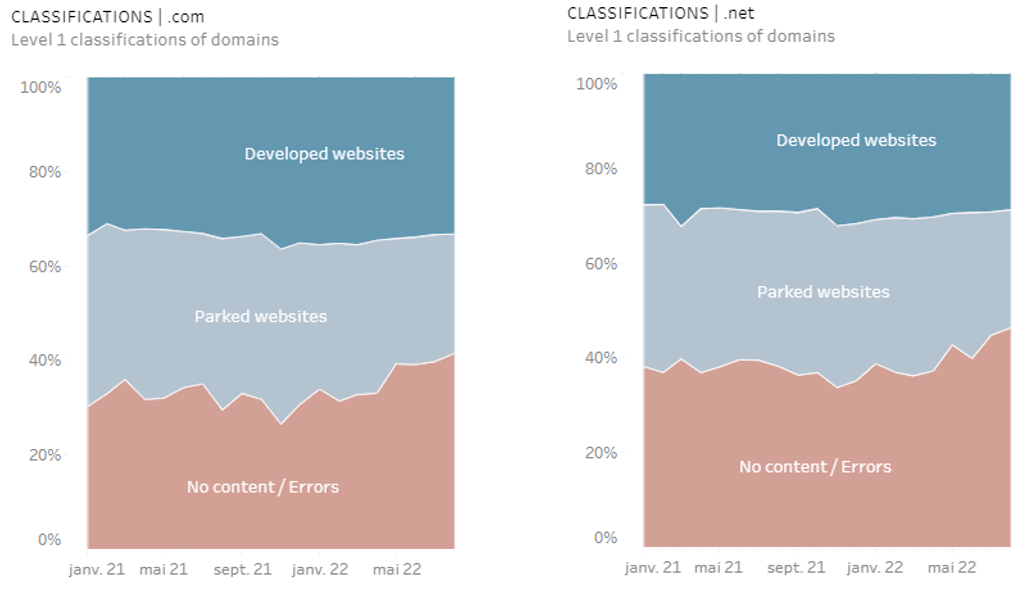
By looking at three types of use, we can measure the vulnerability of the .COM and .NET TLDs to price increases.
The “Developed Websites” category will be the most resilient as it represents ‘real’ users who keep their names whatever happens as long as they’re used. This category accounted for 33% for .COM and 29% for .NET in 2022;
The second category, “Parked Websites”, refers to active names that do not direct to real content: contextual links pages, holding pages, etc. It represents 25% for .COM and 25% for .NET in 2022;
The last category covers names not configured and therefore not used: these account for 42% of .COM and 46% of .NET.
The last two categories notably contain names held by domainers and names registered as a defensive strategy, but also all names registered and not used to date. Conversely, domainers and rights holders can have chosen to activate their names and direct them to ‘real’ websites. The composition of the three categories is thus far from homogeneous and corresponds to different types of holders and needs.
We can, however, conclude from these graphs that 67% of .COM and 71% of .NET domains are at risk of non-renewal if a ‘crisis point’ is reached in terms of prices. These figures are maximums given that rights holders won’t get rid of all their defensive names just like domainers won’t get rid of all their assets. If we limit the proportion of names sensitive to price changes to 33% of these two categories, we obtain 22% for .COM (so between ⅕ and ¼) and 23% for .NET (same).
Verisign’s strategic options
Verisign needs to make a choice between a set of conflicting constraints:
- On the one hand, protecting its revenue and its margins, potentially threatened by the slowdown or decline of its TLDs, by increasing its prices to offset the fall in create operations and names retained;
- On the other hand, protecting its TLDs by maintaining attractive prices so that they remain competitive compared with ccTLDs (local domains) and nTLDs.
If Verisign pushes its price hikes too far, the short-term improvement in its financial results will be offset in the medium term by the accelerated decline of the .NET TLD and an abrupt slowdown of the .COM TLD. If, however, it keeps its prices unchanged, the natural changes in the market will expose it to disappointing financial results for investors used to growth of 5% to 6% on average over the last 10 years.
The strategy that prevailed between 2019 and 2021 was the latter option. Likely in anticipation, as of 2021, of a downward trend that cannot be halted by price stability, Verisign opted to protect its financial result in a bid to satisfy its shareholders in the short term, while exerting an influence on the competitiveness of its TLDs in a context where most its ccTLDs are already less costly than .COM and .NET.
The table below highlights the change in the price differential between .FR and .COM between May 2021 and 1 September 2022. It also incorporates the exchange rate effects against the .COM TLD in 2022.
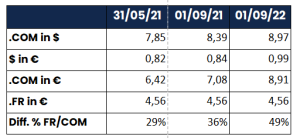
| 31/05/21 | 01/09/21 | 01/09/22 | |
| .COM in $ | 7,85 | 8,39 | 8,97 |
| $ in € | 0,82 | 0,84 | 0,99 |
| .COM in € | 6,42 | 7,08 | 8,91 |
| .FR in € | 4,56 | 4,56 | 4,56 |
| Diff. % FR/COM | 29% | 36% | 49% |
In May 2021, the .FR TLD was 29% less expensive than the .COM domain; at the time of the increase on 1 September 2021, 36% less expensive; on 1 September 2022, 49% less expensive.
The answer to Verisign’s strategy choice thus depends on the holders, but above all, in the shorter term, the registrars who are placed in an uncomfortable situation of having to choose between their already tight profit margins and the good health of their customer portfolios. This situation is compounded by the adverse fluctuations, for European registrars, in the exchange rate.
Only the future will tell if Verisign made the right choice and above all at what level the price impact will be visible for the .COM TLD.
[1] Verisign Reports Second Quarter 2022 Results
[2] Notice of Price Increase for .com Domain Name Registrations – Verisign to ICANN, February 10, 2022
[3] Notice of Price Increase for .com Domain Name Registrations – Verisign to ICANN, February 11, 2021
[4] .com Registry Agreement (2012 revised 2020)
[5] THIRD AMENDMENT TO THE .COM REGISTRY AGREEMENT
[6] .net Registry Agreement (2017)
[7] There appears to have been no reaction from the US Congress during the renegotiation of the .COM contract in 2018-2020.
[8] Verisign Investor Relations website
[9] .com Monthly Registry Reports / .net Monthly Registry Reports
[10] The Creation Rate measures the commercial development of a TLD. It is obtained by comparing the number of create operations in a base year with stock at 31/12 of that year..
[11] The Retention Rate measures what proportion of names present in stock at 01/01 of a base year are retained over that year. It is obtained by comparing the number of names retained (or not deleted) with stock at 01/01 of that year. This should not be confused with the renewal rate, which measures the proportion of names that were up for renewal during the year in question and which were kept. The difference between the two generally lies in the existence of ‘multi-year’ names registered or renewed for a period of 2 to 10 years.
On the same topic
Featured
News

07/20/26
Afnic named registry for eight French overseas TLDs
Afnic, the association responsible for .fr and several French ...
Expert papers
How can the DNS help identify drones remotely?
As part of the Télécom SudParis Cassiopée programme, Afnic ...