- Fee changes for .COM and .NET
- Nominal prices and actual prices
- Impact of the fee increases – which KPIs to measure the performance of the TLDs?
- Assumptions based on the impact of price increases
- KPIs for .COM
- KPIs for .NET
- Factors contributing to the inertia of the KPIs compared to price changes
- Verisign performances by geographic zone
- Verisign’s strategic options
This latest article follows on from the publication in autumn 2022 entitled “Increase of .com and .net prices: between protecting margins and forging ahead?”1. In it we presented the legal context of the price increases announced by Verisign and a certain number of KPIs (Key Performance Indicators), and put forward an analysis as to Verisign’s strategic decisions.
Here we give an update on the KPIs as at 31/12/22 and a “situation update”, in the context of Verisign’s announcement on 9 February 2023 of a future price rise of .COM on 1 September 20232. Still with the aim of evaluating the impact of the fee changes on the performance of the two TLDs, and questioning the Verisign strategy in light of the data collected.
Fee changes for .COM and .NET
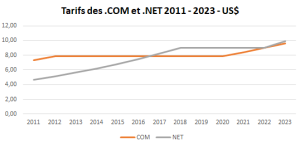
The .COM fee remained unchanged between 2012 and 2021, but has increased by 7% annually since. .NET fees continually rose by 10% per year between 2011 and 2018, before levelling off. They increased by 10% once again in February 2023.
Plotting the .FR and .COM fees in current euros gives a visual representation of the differential between the prices of the two TLDs:
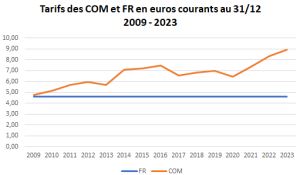
While .FR fees have remained constant since 2019, the price of .COM expressed in euros increased up until 2016 before being lowered in several years (2017-2022), followed by the repeated price adjustments of 2021-2023. Today, the differential is the double (4.6 euros for .FR, slightly less than 9 for .COM).
Nominal prices and actual prices
Do these prices correspond to the prices actually paid by all registrars? Probably not. Verisign is able to run promotional campaigns that play on prices (discounts, etc.) or kickbacks. In our previous post on this topic, we attempted to calculate the difference between the notional revenue and actual revenue, which can give an idea of the discounts. But this figure (6.6% in 2022, in other words actual revenue is 7% below notional revenue) likely only renders part of the efforts undertaken by Verisign to support the growth of its revenues.
Impact of the fee increases – which KPIs to measure the performance of the TLDs?
To conduct our study, we will be using two performance indicators taken from the reports sent by Verisign to ICANN and published in its ‘Registry transactions Reports’3: stocks at 31/12 of each year and monthly creations consolidated annually.
Based on these two official indicators, we can calculate the others: the volume of names retained and deleted over the year, the stock change, create and delete operations, the creation rate4 and retention rate5. This wide-ranging data gives us an idea of how the two TLDs behave and allows us to assess the impact of the pricing policy.
Assumptions based on the impact of price increases
Before considering the data collected, it is worth pointing out what we should expect to see to confirm the existence of a negative impact of price increases on .COM and .NET activity. Indeed, this phenomenon is not the only thing that influences Verisign sales levels: the general economic trend or the political situation can also be aggravating or mitigating factors. We therefore need to consider longer-term developments, without placing too much importance on short-term fluctuations.
We could consider that price increases have had a negative impact if we see:
- on the one hand, create operations fall significantly below ‘normal level’ (that is to say under 35 to 38 million names per year) with the result that the Creation Rate moves towards 20% over the medium term;
- on the other hand, retained names decline, leading to a marked deterioration in the Retention Rate moving towards 75% over the medium term
- the consequence of these two changes combined would be a loss of stock in varying degrees.
Faced with relatively brutal and repeated price increases, the holders of unused names will be forced to make trade-offs sooner or later to avoid overshooting their .COM budget. The two main categories of holders concerned are domainers, with portfolios of varying sizes destined for resale or ‘monetisation’, and rights holders who have registered a large number of names as a defensive measure to protect their brands. VSEs/SMEs and natural persons using their .COM domains will tend to keep them, on the other hand, as price hikes are not a critical factor for them given that they only generally hold a limited number of domain names.
KPIs for .COM
This brings us to the table below6:
.COM KPIs – in millions :
|
2018 |
2019 |
2020 |
2021 |
2022 |
|
| Stock on 12/31 | 142 049 | 148 817 | 155 320 | 163 501 | 164 412 |
| Creations years | 35 476 | 37 816 | 39 421 | 41 880 | 37 521 |
| Maintained names |
106 573 | 111 001 | 115 899 | 121 621 | 126 891 |
| Deleted names |
28 454 | 31 048 | 32 919 | 33 699 | 36 610 |
| Stock variations |
5,2% | 4,8% | 4,4% | 5,3% | 0,6% |
| Creation variations |
6,5% | 6,6% | 4,2% | 6,2% | -10,4% |
| Maintained variations |
4,8% | 4,2% | 4,4% | 4,9% | 4,3% |
| Deletion variations |
-4,0% | 9,1% | 6,0% | 2,4% | 8,6% |
| Creation rate |
25,0% | 25,4% | 25,4% | 25,6% | 22,8% |
| Maintenance rate |
78,9% | 78,1% | 77,9% | 78,3% | 77,6% |
The data presented trace the history of the .COM TLD over the last five years, according to the official data supplied by Verisign to ICANN. What we are more particularly interested in here is the behaviour of the TLD in the wake of the price increase on 1 September 2021. So what happened in 2022?
- A significant slowdown in growth which dropped from 5.3% to 0.6%
- A sharp drop in create operations (-10%), which should however be put in perspective given that 2021 represented an exceptional high linked to the COVID situation. 2022 creations stood at around 37.5 million, slightly below the 2019 level, meaning that the ‘spectacular’ fall is therefore, in reality, merely a return to ‘normal’ activity levels, all things being equal.
- A substantial increase in deletions, up from 33.7 million in 2021 to 36.6 million in 2022 (the 8.6% variation is above that of creations in 2021 (+6.2%), which demonstrates the ‘tension’ in deletions).
Let’s now look at the changes in the Creation Rate and Retention Rate of the .COM TLD:
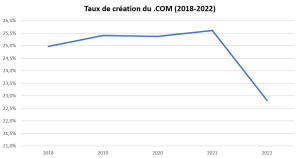
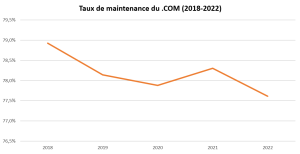
The Creation Rate, slightly up between 2018 and 2021, slumped dramatically by 2.5 points in 2022.
The Retention Rate, down 1 point in 2018-2020 before increasing again in 2021, seems to have returned to its long-term downward trend in 2022, highlighting the exceptional nature of 2021.
The magnitude of these variations is significant, as is the fact that they occur simultaneously.
Nevertheless, a plausible explanation for these phenomena would be that create operations returned to a more ‘normal’ level than in 2020 and 2021, the creation rate dropping through the simple effect of stock variations; and that delete operations increased due to the 2020 and 2021 creations reaching expiry and not being renewed.
These changes can be seen in many other TLDs. It could, therefore, be argued that the fee increases are likely to accentuate the phenomenon, without being the root cause thereof, at least in 2022. The accentuation is plausible: even though the other major TLDs (and particularly ccTLDs) have experienced similar developments, few of them ended 2022 at an equilibrium like .COM did.
If we think in terms of overall numbers, one possible hypothesis is that without the fee increases, the growth of the .COM TLD would have been 2 to 3%. The potential impact of the fee increase could therefore be evaluated at 2 growth points, i.e. 3.3 million ‘transactions’ lost (creations and renewals).
KPIs for .NET
Now let’s look at the same indicators for the .NET TLD. As we can see, it has a very different physiognomy. It should be noted that prices stabilised in 2022, the 10% increase only having come into force on 1 February 2023.
.NET KPIs – in millions
|
2018 |
2019 |
2020 |
2021 |
2022 |
|
|---|---|---|---|---|---|
| Stock on 12/31 | 14 288 | 13 737 | 13 704 | 13 702 | 13 503 |
| Creations years |
2 762 | 2 456 | 2 561 | 2 660 | 2 454 |
| Maintained names |
11 527 | 11 281 | 11 142 | 11 043 | 11 049 |
| Deleted names |
3 424 | 3 007 | 2 594 | 2 661 | 2 653 |
| Stock variations |
-4,4% | -3,9% | -0,2% | 0,0% | -1,5% |
| Creation variations |
-8,8% | -11,1% | 4,3% | 3,8% | -7,7% |
| Maintained variations |
-3,3% | -2,1% | -1,2% | -0,9% | 0,1% |
| Deletion variations |
-18,8% | -12,2% | -13,7% | 2,6% | -0,3% |
| Creation rate |
19,3% | 17,9% | 18,7% | 19,4% | 18,2% |
| Maintenance rate |
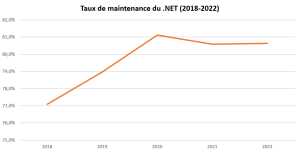
77,1% | 79,0% | 81,1% | 80,6% | 80,6% |
The stock of .NET have steadily declined since 2015, down from 16.2 million to 13.5 million at the end of 2022. Create operations have followed the same dynamic, down from 4.3 million in 2015 (an exceptional level) to 2.5 million in 2022. The database of retained names and the level of delete operations remained stable overall in 2022.
2022 was characterised by a certain stability:
- A slight decline in stock (-1.5%) after two years of equilibrium;
- A fairly substantial fall in create operations (-8%) compared to 2021, at a level (2.5 million) well below 2019;
- A database of retained names in equilibrium (+0.1%) and delete operations down slightly (-0.3%)
So let’s look at the .NET Create Rate and Retention Rate over the past five years:
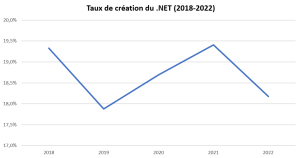
The create rate has fluctuated between 18 and 19.5% since 2018. In 2022 it returned to its 2019 level.
The retention rate increased by 4 points between 2018 and 2020, before levelling off at under 81% in 2021-2022.
‘Return to normal’ for creations, stabilisation of deletions… the .NET TLD did not really experience a crisis in 2022. In contrast, it could suffer in 2023 from the fee increase that came into force in February of the same year.
Factors contributing to the inertia of the KPIs compared to price changes
Here we will go over some of the factors that could explain a certain inertia in the KPIs compared to the price changes (relative inertia as shown by the .COM TLD):
- Existence of promotional operations of all types making the price increases less ‘painful’ for registrars;
- Reluctance of registrars to pass on the full cost of the price rise to their customers (registrars prefer to compromise on their margins in this case rather than to risk losing customers);
- Inertia of holders who have not kept an eye on the fee changes; they subsequently think in terms of streamlining their portfolio, when the budget becomes too much.
Verisign performances by geographic zone
The data submitted to SEC by Verisign7 show the changes in revenues (that is to say, in terms of overall numbers, in its .COM activity) broken down by geographic zones.
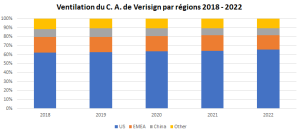
In 2022, revenue grew overall by 7%, which corresponds to the order of magnitude of the fee increases. But the changes are contrasted depending on the regions: 10% in the USA, -2% for EMEA, 6% for China, 7% for the rest of the world.
These figures do not necessarily exactly coincide with the activity flows since more or less aggressive commercial operations can be inserted in between. In any case, a gradual refocusing can be seen, whether deliberate or not, on the US market (biases may exist insofar as the big US registrars, Verisign customers, themselves work with dealer networks around the world, which is not reflected in the regional breakdown of the company’s revenues).
In terms of relative weight, the US gained 4 points between 2018 and 2022 (66% in 2022) while EMEA lost 2 points (16% in 2022) and China 2 points (7% in 2022), and the rest of the world remained stable at 11%.
Two lessons emerge; on the one hand, the activity in China, heavily influenced by domaining if we believe the information available on other TLDs, continued to develop in 2022. On the other hand, activity in EMEA and therefore in Europe has sharply declined (to cause a 2% fall in revenue with a price increase of 7%, activity loss must be around 9%).
Could this point reflect the impact of fee increases, which make the .COM TLD less and less competitive compared with other ccTLDS, Europe being the world region where the latter are the most entrenched in the habits of Internet users? It is as though the trade-offs between an increasingly expensive .COM and relatively less and less expensive ccTLDs were already at work.
Verisign’s strategic options
Today Verisign needs to make a choice, under constraint, between two factors: its revenue and its net profit.
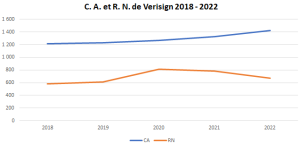
Revenue is faithfully following the gradient of the fee increases, and should reach $1.5 billion by 2024 or 2025.
Net profit, on the other hand, fell in 2020-2022, more particularly in 2022. Net margin, 64% in 2020, fell to 59% in 2021 and to 47% in 2022. These figures show that the fees negotiated with ICANN make Verisign one of the most profitable Nasdaq companies. And yet, this trend could be worrying if expressed in the following question: which should be protected, revenue growth or margins?
One scenario could be that in 2021/2022, Verisign placed the priority on revenue by perhaps ‘buying’ growth through promotional operations that weighed on its costs (without prejudice to other factors in cost increases).
But in the future, will the Verisign shareholders, mostly hedge funds and corporate investors, prefer to maintain revenue growth or restore margins and thus profitability?
If we take the second option, it is possible that there will be a shortage of means to finance commercial operations; which would have the immediate effect of exacerbating the impact of fee increases, given that the activity level is no longer ‘sustained’.
The other scenario is unlikely, as the company’s value for its shareholders lies in its immense profitability: if this were to continue to drop, the effect on the market price could prove disastrous (the capitalisation/revenue ratio was 21 at the end of 2021 and 15 end 2022: despite this very high ratio, its sensitivity can be calculated in relation to profitability).
Unless the domain name market returns to the positive trend of 2010-2019, Verisign’s situation is likely to become increasingly difficult, since its strategic business choices – which dictate that it protect the development of its flagship product – will increasingly clash with the expectations of its shareholders. ‘Customer acquisition costs’ are increasingly high, which could explain Verisign’s comparatively weak dynamic outside of North America: where .COM is not an ‘obvious choice’, the company does not seem to have chosen to invest the necessary resources to make it so.
The future performance of the .COM TLD will reflect the response of Verisign’s management to this thorny issue.
1 – Increase of .com and .net prices: between protecting margins and forging ahead? https://www.afnic.fr/en/observatory-and-resources/expert-papers/increase-of-com-and-net-prices-between-protecting-margins-and-forging-ahead/
2 – Notice of Fee Increase for .com Domain Name Registrations https://www.icann.org/en/system/files/correspondence/stewart-to-costerton-09feb23-en.pdf
3 – .com Monthly Registry Reports https://www.icann.org/resources/pages/com-2014-03-04-en / .net Monthly Registry Reports https://www.icann.org/resources/pages/net-2014-03-04-en
4 – The Creation Rate measures the commercial development of a TLD. It is obtained by comparing the number of create operations in a base year with stock at 31/12 of that year.
5 – The Retention Rate measures what proportion of names present in stock at 01/01 of a base year are retained over that year. It is obtained by comparing the number of names retained (or not deleted) with stock at 01/01 of that year. This should not be confused with the renewal rate, which measures the proportion of names that were up for renewal during the year in question and which were kept. The difference between the two generally lies in the existence of ‘multi-year’ names registered or renewed for a period of 2 to 10 years.
6 – The 2012 to 2017 data are presented in our October 2022 article “Increase of .com and .net prices: between protecting margins and forging ahead?“
7 – https://investor.verisign.com/sec-filings/sec-filing/10-k/0001014473-23-000005
On the same topic
Featured
News

04/08/26
Afnic’s mediation service proves its effectiveness
Afnic has published the latest review of its mediation service. ...
Expert papers
How can the DNS help identify drones remotely?
As part of the Télécom SudParis Cassiopée programme, Afnic ...