
This article gives an analysis of the .COM TLD based on data transmitted by Verisign, the company tasked with the management of .COM, to ICANN, as of 30/06/23.
To conduct our study, we will be using two performance indicators taken from the reports sent by Verisign to ICANN and published in its ‘Registry transactions Reports’1: stocks at 30/06 and 31/12 of each year and monthly creations consolidated over a 12-month period.
Based on these two official indicators, we can calculate the others: the volume of names retained and deleted over the last 12 months, the stock change, create and delete operations, the creation rate and retention rate.
Fee changes for .COM and .NET
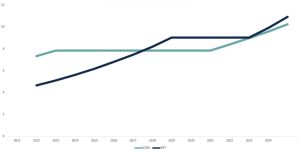
The .COM fee remained unchanged between 2012 and 2021, but has increased by 7% annually since. .NET fees continually rose by 10% per year between 2011 and 2018, before levelling off. They increased by 10% once again in February 2023 and Verisign has already notified ICANN of a subsequent increase on 1 February 20242.
.COM and .NET fees in US Dollars (2011-2024)
Nominal prices and actual prices
Do these prices correspond to the prices actually paid by all registrars? Probably not. Verisign is able to run promotional campaigns that play on prices (discounts, etc.) or kickbacks, but we need to stick to the nominal fees given the lack of public information on the subject.
Likely impacts of the nominal fee increases
Faced with relatively brutal and repeated price increases, the holders of unused names will be forced to make trade-offs sooner or later to avoid overshooting their .COM and/or .NET budget. The two main categories of holders concerned are domainers, with portfolios of varying sizes destined for resale or ‘monetisation’, and rights holders who have registered a large number of names as a defensive measure to protect their brands. VSEs/SMEs and natural persons using their .COM and .NET domains will tend to keep them, on the other hand, as price hikes are not a critical factor for them given that they only generally hold a limited number of domain names.
Trend in create and delete operations for .COM
.COM create operations experienced a particularly prosperous period between Q3 2020 and Q4 2021 with a quarterly rate of over 10 million and a spike of 11 million in Q2 2021. They fell below 10 million again since Q1 2022 with a rebound in 2023.
.COM creations and deletions by trimester (2020-2023)
Delete operations have kept pace with create operations, as usual, with a one-year time lag (in addition to the Grace Period). Thus create operations at the end of 2020 and early 2021 are reflected in an increased delete rate as of Q2 2022, reaching over 9 million before dropping again in Q1 2023. This phenomenon is par for the course and did not arouse particular concern. Nevertheless, Q2 2023 has shown an unexpected return of delete operations which should, theoretically, have stood at around 8-9 million but which in fact are closer to 10 million.
.COM net balance by trimester (2020-2023)
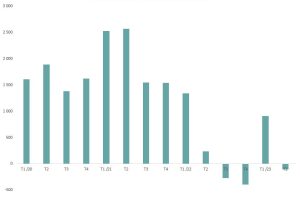
This trend has impacted the Q2 2023 net balance which is slightly down on Q1 2023, to all appearances restoring the pre-2022 dynamic. These unexpected fluctuations make it difficult to predict performances for the second half of 2023. In principle, .COM should be in the black, but the high level of deletions may reflect a fragility linked to increased numbers of non-renewals due to the fee rises.
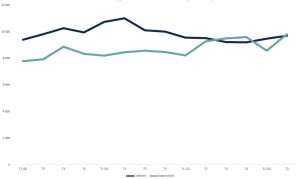
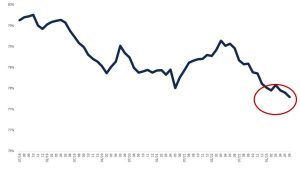
.COM growth on 12 months (2018-2023)
.COM has long been the driving force behind the domain name market. The combination of lower create rates and higher delete rates as of Q1 2022 has caused a break in the momentum driving growth, which now stands at around 5%. Annual growth continued to decline up until Q1 2023 when it began to stabilise. But despite the fact that this stabilisation has been confirmed in the second half of 2023, the TLD should be relatively balanced across the year.
.COM creation rate (2018-2023)
The create rate3 has followed more or less the same pattern, dropping drastically as of the start of 2022 and stabilising in 2023. It is still too early to predict a recovery and to what degree.
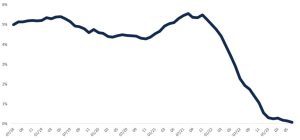
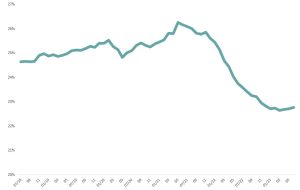
.COM maintenance rate (2018-2023)
Having long remained within the 77.5% – 78.5% bracket, the retention rate for .COM dropped below 77.5% in Q1 2023 and continued on the decline under way since Q3 20224.
Analyses and lessons
Despite their spectacular character, changes to KPIs for the .COM TLD in 2021/2022 were similar to those for the other major ccTLDs boosted by COVID in 2020/2021 before coming down to a relatively hard landing in 2022.
From this point of view, the impact of the fee increases was impossible to measure and we can only assume that it was an aggravating factor in terms of amplitude (fewer creations, more deletions, therefore a net balance more negative than it would have been at stable fees).
In 2023 the beginnings of a new phenomenon have become clear with higher delete rates in Q2 2023 than expected. This may, of course, be a result of the global economic situation, but the changes shown by the other major TLDs demonstrate a growth dynamic stabilising at around 2% whereas the .COM rate is at equilibrium.
Using ‘coarse’ reasoning, we could consequently put forward the hypothesis that the accumulated fee increases since 2021 have cost .COM 2 growth points over the last 12 months, i.e., at its level, approximately 3.3 million names broken down between create operations not carried out and additional delete operations.
We previously examined Verisign’s strategic options in our October 2022 article. It is likely that performances in the second half of 2023 will confirm or rebut our analyses while also identifying the directions taken by the company’s strategists. Verisign’s Third Quarter Report shows a net decrease of 0.5 million .COM and .NET during the third quarter. For now the priority seems still to be offsetting the decline in volumes by raising fees, a choice that may prove risky if this exacerbates the decline.
1 – .com Monthly Registry Reports https://www.icann.org/resources/pages/com-2014-03-04-en .net Monthly Registry Reports https://www.icann.org/resources/pages/net-2014-03-04-en
2 – Jacquelyn S. Stewart to Sally Costerton – 27 July 2023 https://www.icann.org/en/system/files/correspondence/stewart-to-costerton-27jul23-en.pdf
3 – The Creation Rate measures the commercial development of a TLD. It is obtained by comparing the number of create operations in a base year with stock at 31/12 of that year.
4 – The Retention Rate measures what proportion of names present in stock at 01/01 of a base year are retained over that year. It is obtained by comparing the number of names retained (or not deleted) with stock at 01/01 of that year. This should not be confused with the renewal rate, which measures the proportion of names that were up for renewal during the year in question and which were kept. The difference between the two generally lies in the existence of ‘multi-year’ names registered or renewed for a period of 2 to 10 years.
On the same topic
Featured
News

07/20/26
Afnic named registry for eight French overseas TLDs
Afnic, the association responsible for .fr and several French ...
Expert papers
How can the DNS help identify drones remotely?
As part of the Télécom SudParis Cassiopée programme, Afnic ...